xgboost - Gradient Boosting
xgbVivid.RmdThis guide is designed as a quick-stop reference of how to use some
of the more popular machine learning R packages with vivid.
In the following examples, we use the air quality data for regression
and the iris data for classification.
xgboost - eXtreme Gradient Boosting
The xgboost package (short for eXtreme Gradient
Boosting) is an implementation of gradient boosting that supports
regression and classification.
As seen in Section Custom Predict Function, the
xgboost package requires the user to supply a custom
predict function to work with vivid. When setting the
data argument in xgboost, remember to include
all the variables (including the response). When producing the custom
predict function, the structure must match that in the below example.
Note that the term data must be used and not the actual
name of the data.
# load data
aq <- na.omit(airquality)

# build xgboost model
gbst <- xgboost(data = as.matrix(aq[,1:6]),
                label =  as.matrix(aq[,1]),
                nrounds = 100,
                verbose = 0)

# predict function for GBM
pFun <- function(fit, data, ...) predict(fit, as.matrix(data[,1:6]))


# vivid
vi <- vivi(data = aq, fit = gbst, response = 'Ozone', predictFun = pFun)
Heatmap
viviHeatmap(mat = vi)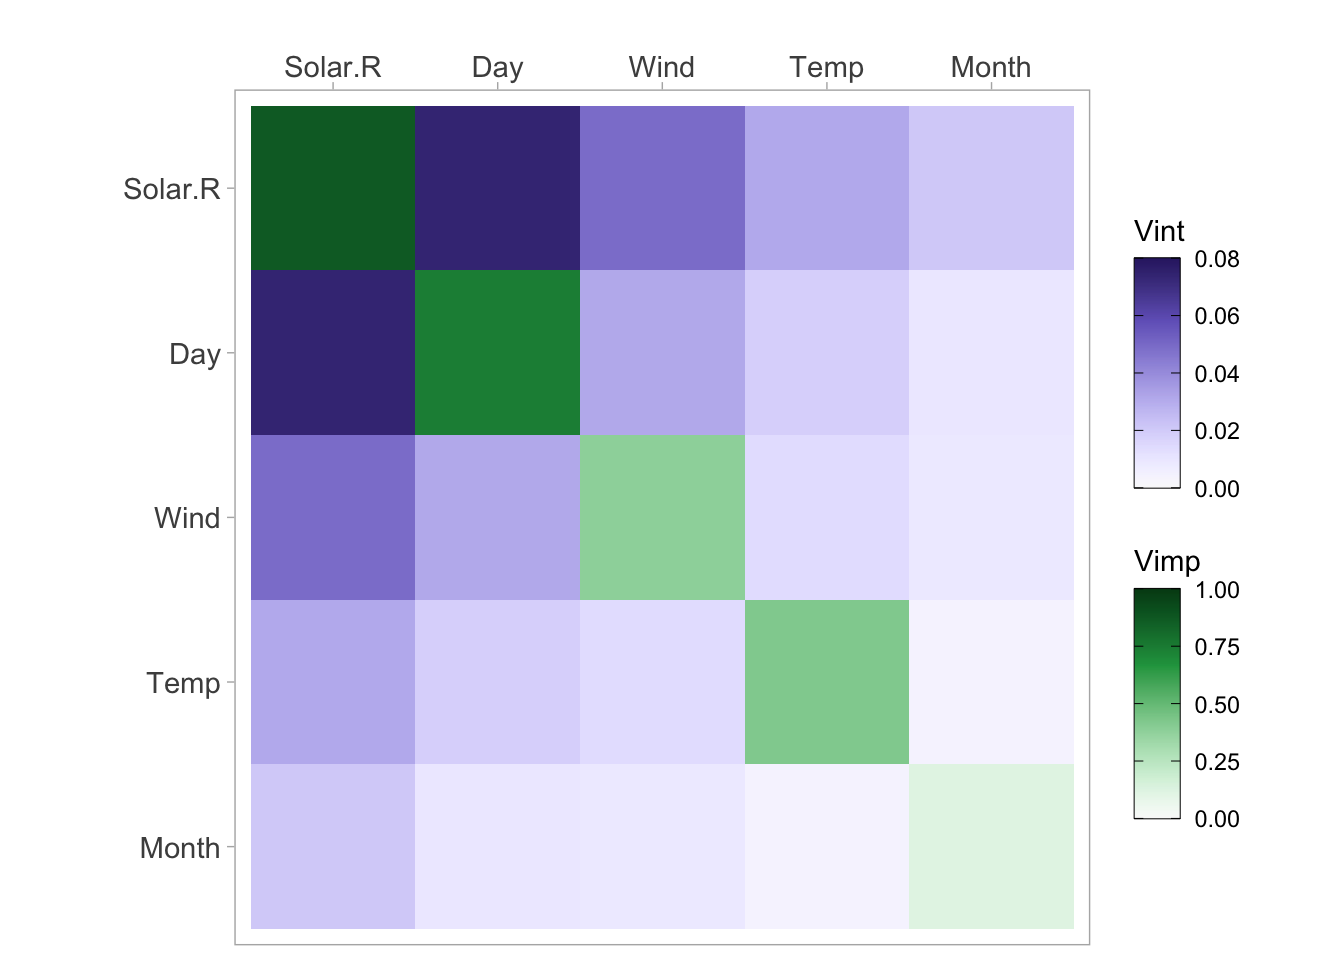
PDP
pdpPairs(data = aq,
         fit = gbst,
         response = "Ozone",
         nmax = 50,
         gridSize = 4,
         nIce = 10,
         predictFun = pFun)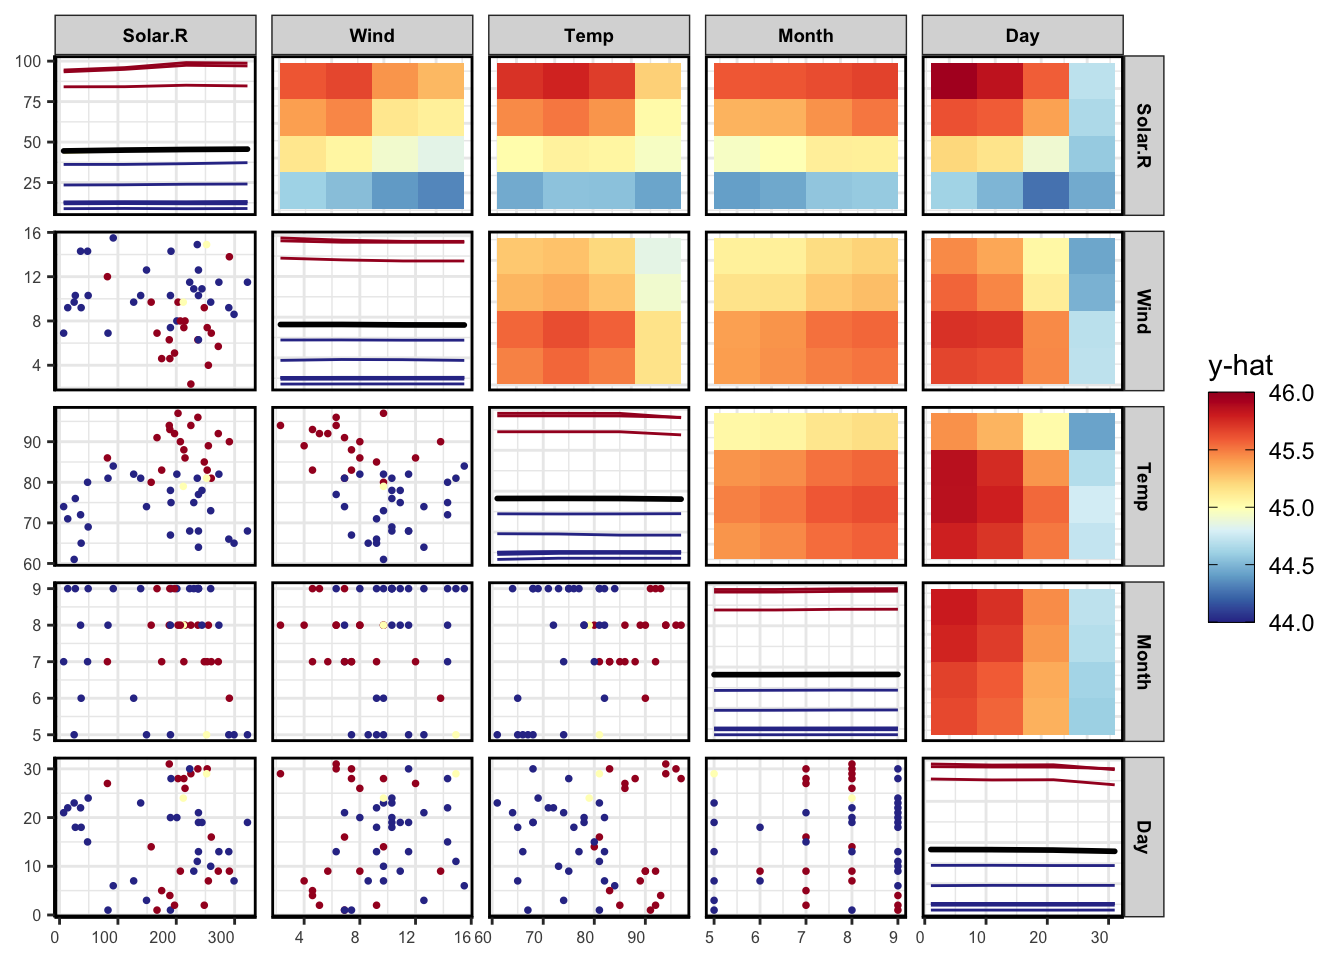
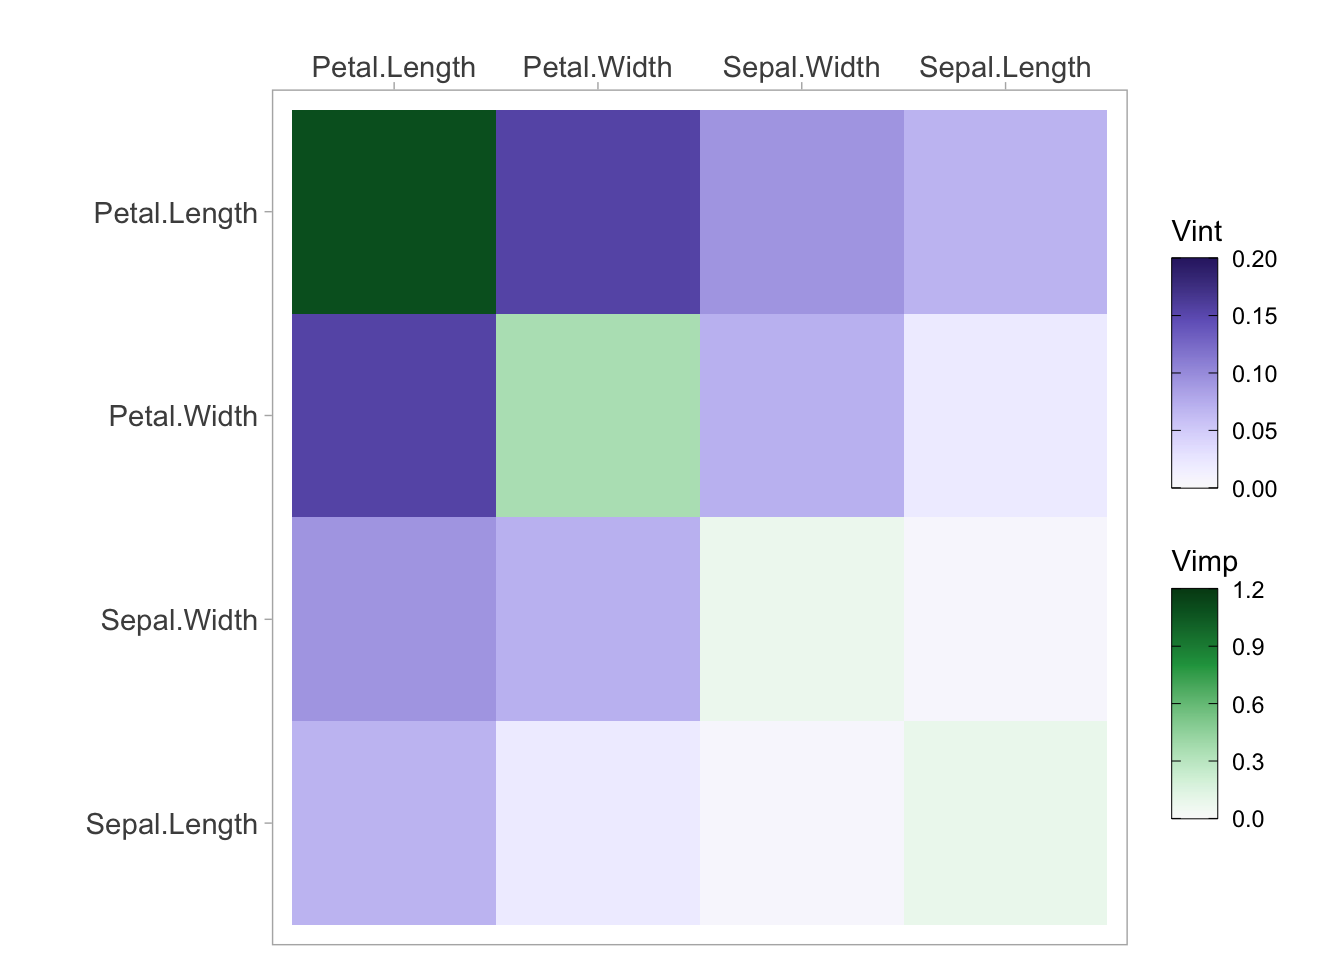
Classification
iris$Species <- as.numeric(iris$Species) - 1


# Create a DMatrix object
dtrain <- xgb.DMatrix(data = as.matrix(iris[, -5]), label = iris$Species)

# Set parameters
params <- list(
  objective = "multi:softprob",
  num_class = 3,
  eval_metric = "mlogloss"
)

# Train the model
bst_model <- xgb.train(params, dtrain, nrounds = 100)


# Define the custom prediction function
pFun <- function(fit, newdata,...) {
  # Create a DMatrix object from the new data
  dnewdata <- xgb.DMatrix(data = as.matrix(newdata)[,-5])

  # Use the predict method from xgboost to get predictions
  preds <- predict(bst_model, dnewdata)

  # Since xgboost returns probabilities for each class,
  # we convert them to class labels
  pred_labels <- max.col(matrix(preds, ncol = length(unique(newdata$Species)), byrow = TRUE)) - 1

  # If the function expects probabilities, you can return 'preds' instead
  # Otherwise, return the predicted class labels
  return(pred_labels)
}


# vivid
vi <- vivi(data = iris, fit = bst_model, response = 'Species', class = 'setosa', predictFun = pFun)
viviHeatmap(mat = vi)