keras - Neural Network
kerasVivid.RmdThis guide is designed as a quick-stop reference of how to use some
of the more popular machine learning R packages with vivid.
In the following example, we use the air quality data for
regression.
keras - Neural Network
The keras package in R is an interface to the original
keras Python library. It allows R users to build and train
neural network models using the high-level Keras API. To use
keras the data must first be normalised. Due to the
complexity custom model fits in keras, producing a custom
predict function to use with vivid may require some work.
In the example below, we show how to use vivid when
building a keras model composed of a linear stack of layers
(i.e., using keras_model_sequential). Additionally,
currently the PDP plots in vivid only work for the
development version on GitHub.
# load data
aq <- na.omit(airquality)
# Set up data
train_data <- aq %>%
  as.matrix()
train_targets <- aq$Ozone

# Normalize the data
mean <- apply(train_data, 2, mean)
std <- apply(train_data, 2, sd)
aqTrain <- scale(train_data, center = mean, scale = std)

# Define model architecture
build_model <- function() {
  model <- keras_model_sequential() %>%
    layer_dense(units = 64, activation = "relu",
                input_shape = dim(aqTrain)[[2]]) %>%
    layer_dense(units = 64, activation = "relu") %>%
    layer_dense(units = 1)
  model %>% compile(
    optimizer = "rmsprop",
    loss = "mse",
    metrics = c("mae")
  )
}

# Train the final model
model <- build_model()
model %>% fit(train_data, train_targets, epochs = 80,
              batch_size = 16, verbose = 0)

# Create usable data frame from scaled data
aqFinal <- as.data.frame(aqTrain)

# predict function for keras
vi_fun <- function(fit, data,...) {
  predict(fit, x = as.matrix(data))
}

# vivid
vi <- vivi(data = aqFinal,
           fit = model,
           response = 'Ozone',
           predictFun = vi_fun)
Heatmap
viviHeatmap(mat = vi)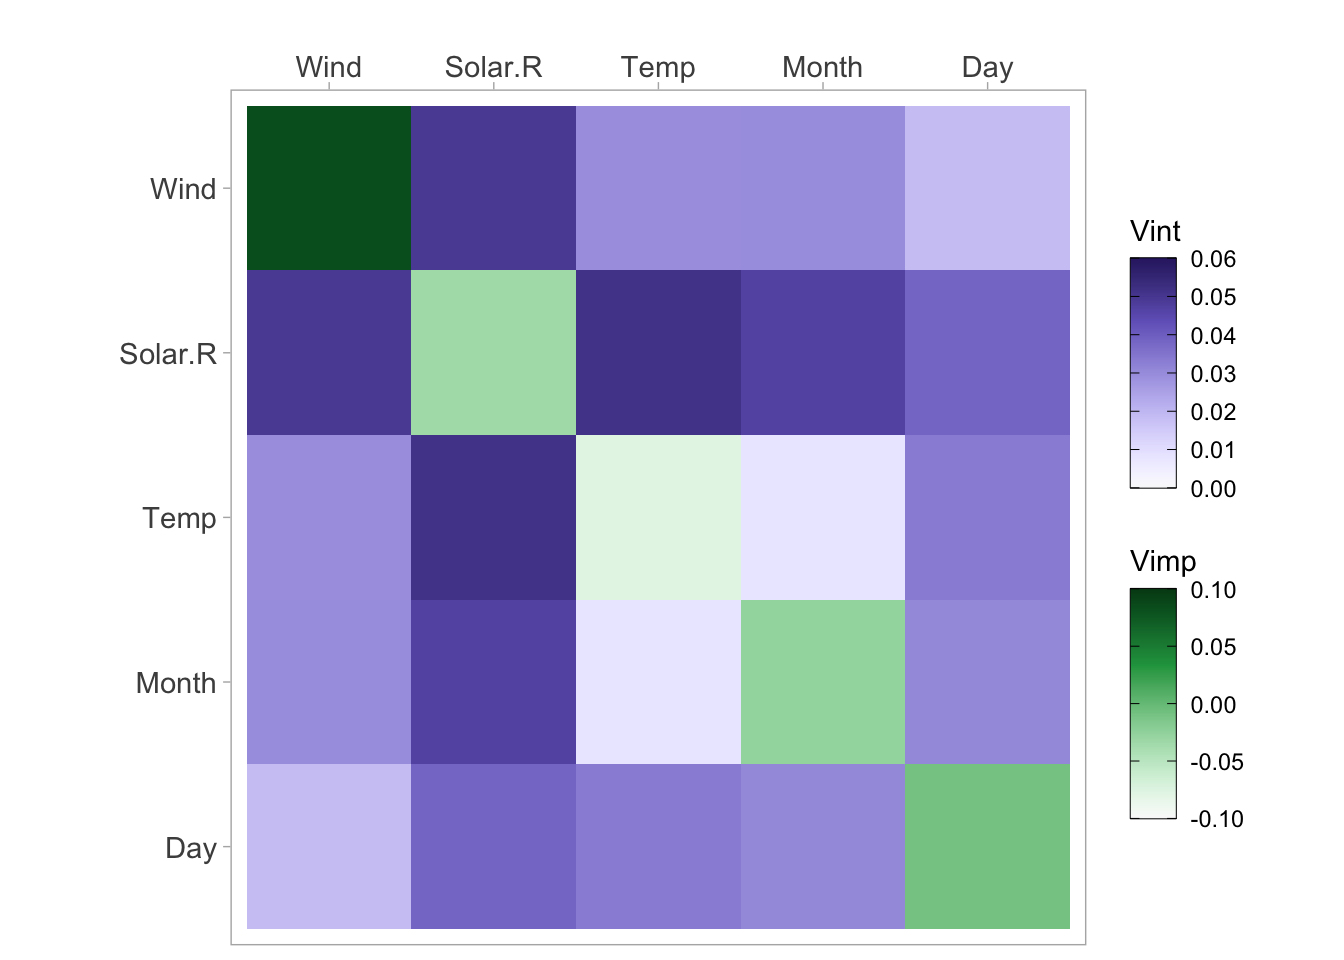
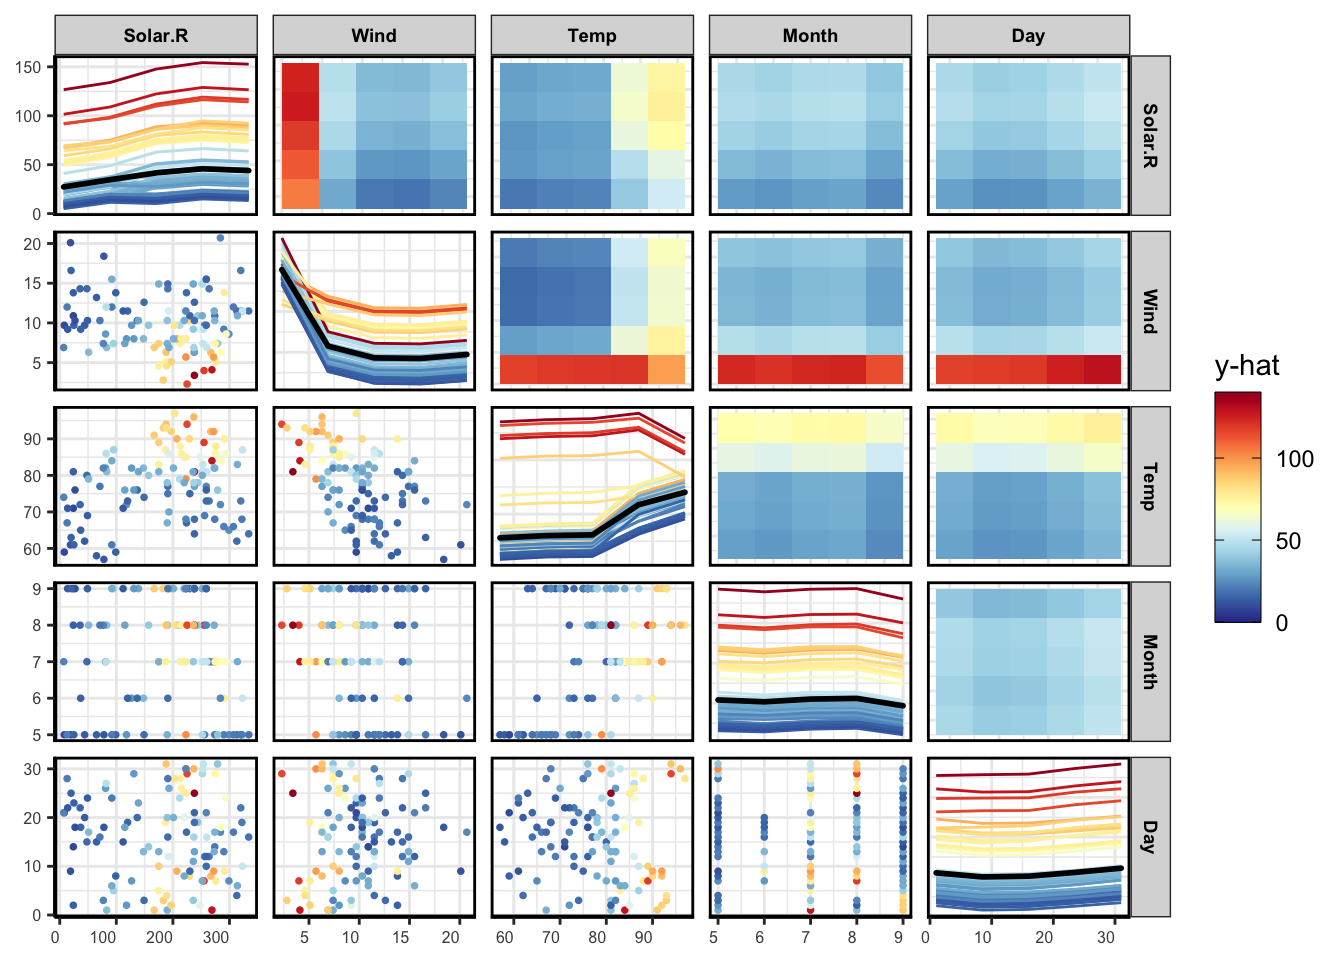
PDP
pdpPairs(data = aqFinal,
         fit =  model,
         response = "Ozone",
         nmax = 500,
         gridSize = 10,
         nIce = 100,
         predictFun = vi_fun)