bartMachine - BART
bartMachineVivid.RmdThis guide is designed as a quick-stop reference of how to use some
of the more popular machine learning R packages with vivid.
In the following examples, we use the air quality data for regression
and the iris data for classification.
bartMachine - BART
The bartMachine package in R provides an implementation
of Bayesian Additive Regression Trees (BART), a non-parametric Bayesian
model which uses decision trees as the underlying model. To begin we
load the packages and data.
Regression
# load data
aq <- na.omit(airquality)


# build bartMachine model
bm <- bartMachine(X = aq[,2:6],
                  y = aq[,1],
                  num_trees = 20,
                  num_burn_in = 100,
                  num_iterations_after_burn_in = 500)


# vivi matrix
vi <- vivi(data = aq, fit = bm, response = 'Ozone')
Heatmap
viviHeatmap(mat = vi)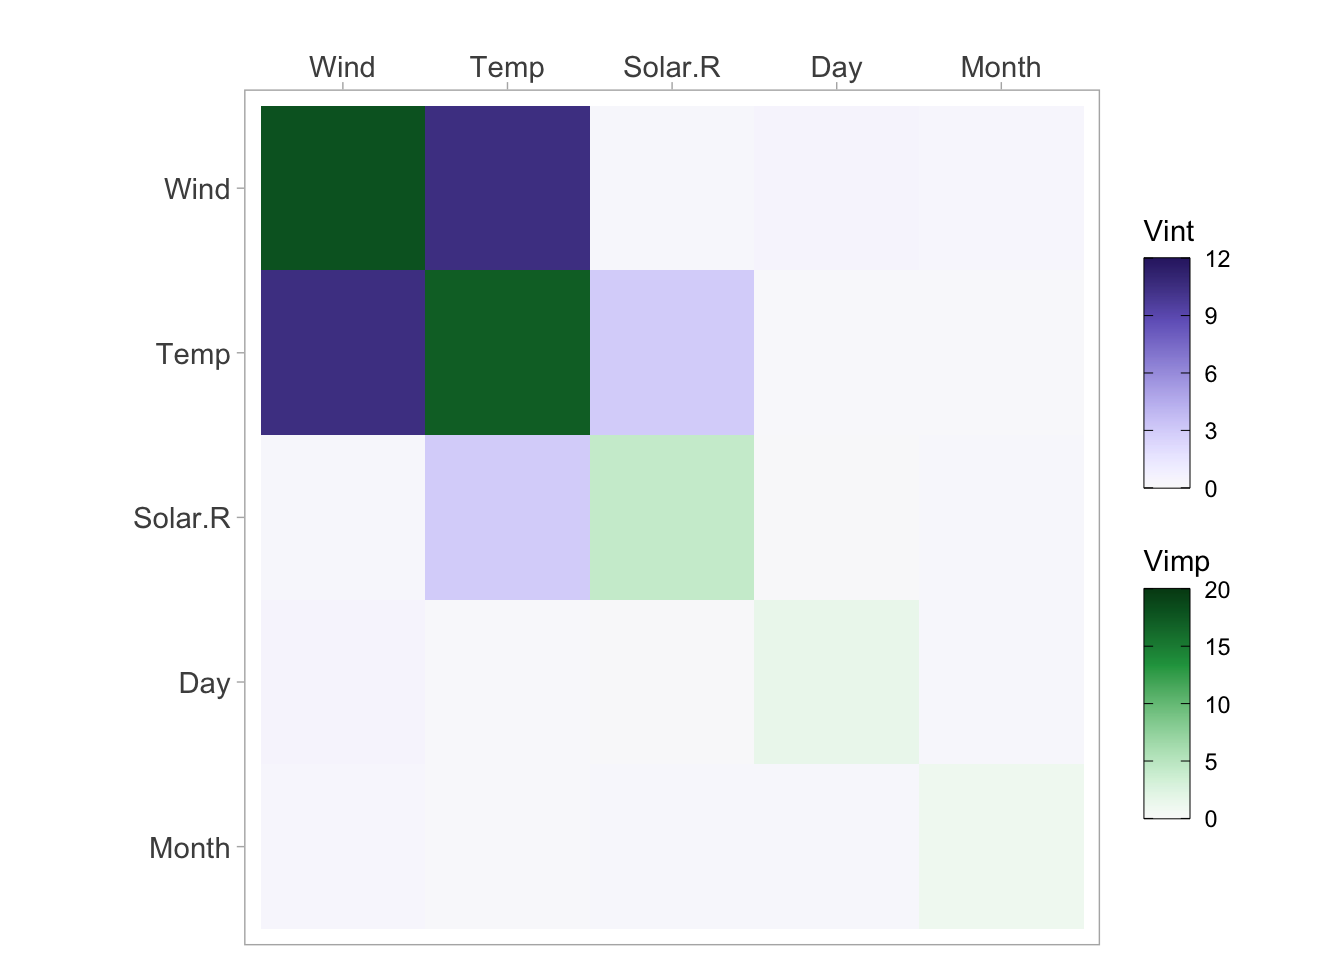
PDP
pdpPairs(data = aq,
         fit =  bm,
         response = "Ozone",
         nmax = 500,
         gridSize = 10,
         nIce = 50)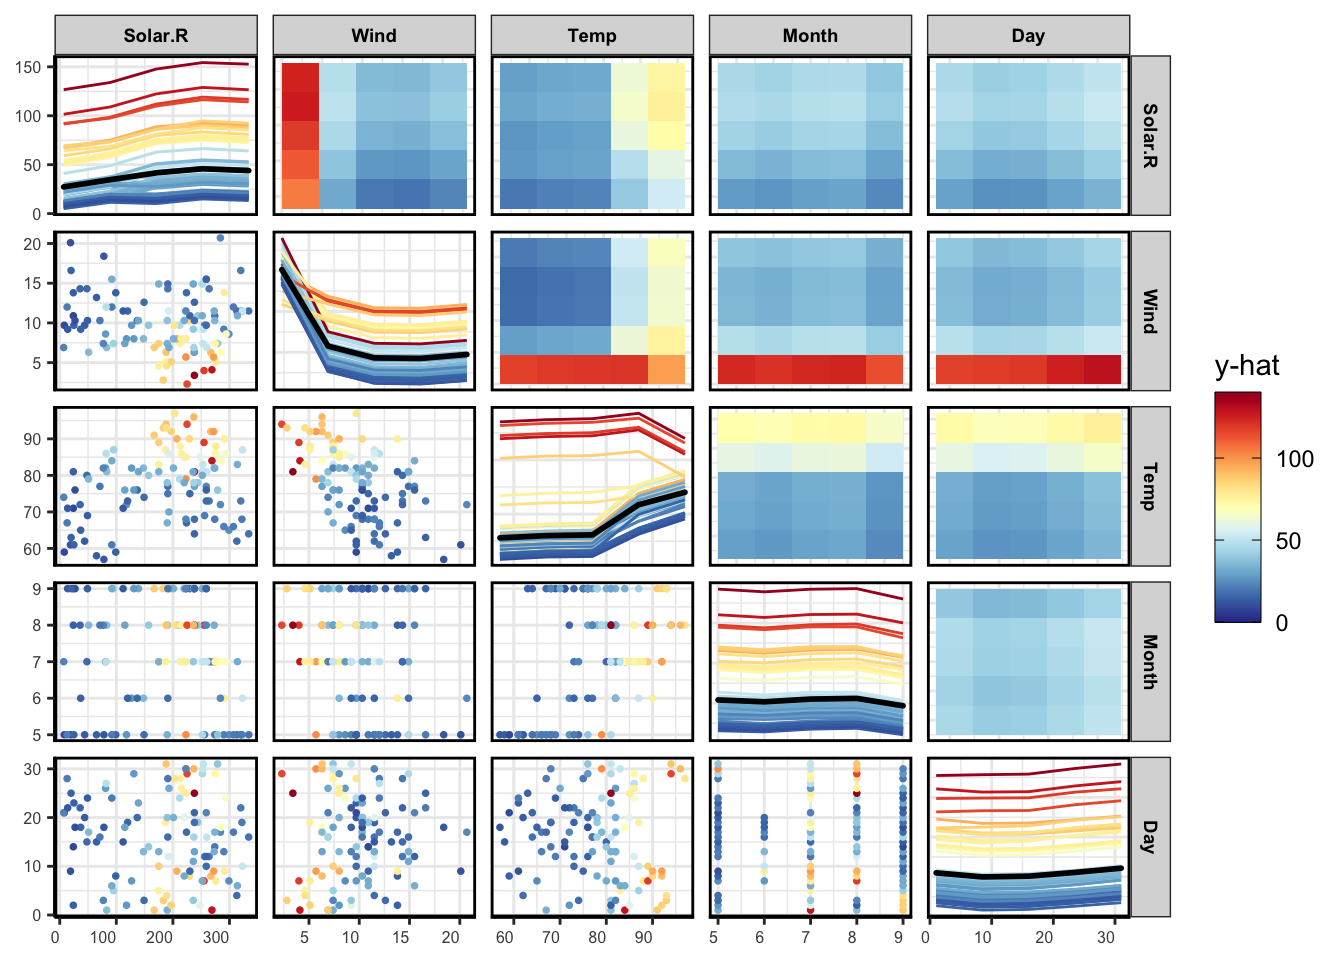
Classification
# Get data and only use 2 factors
data(iris)
iris2 = iris[51:150,]
iris2$Species = factor(iris2$Species)

bm <- build_bart_machine(iris2[ ,1:4], iris2$Species,
                         num_trees = 20,
                         num_burn_in = 100,
                         num_iterations_after_burn_in = 500)

# vivid
vi <- vivi(data = iris2, fit = bm, response = 'Species')
Heatmap
viviHeatmap(mat = vi)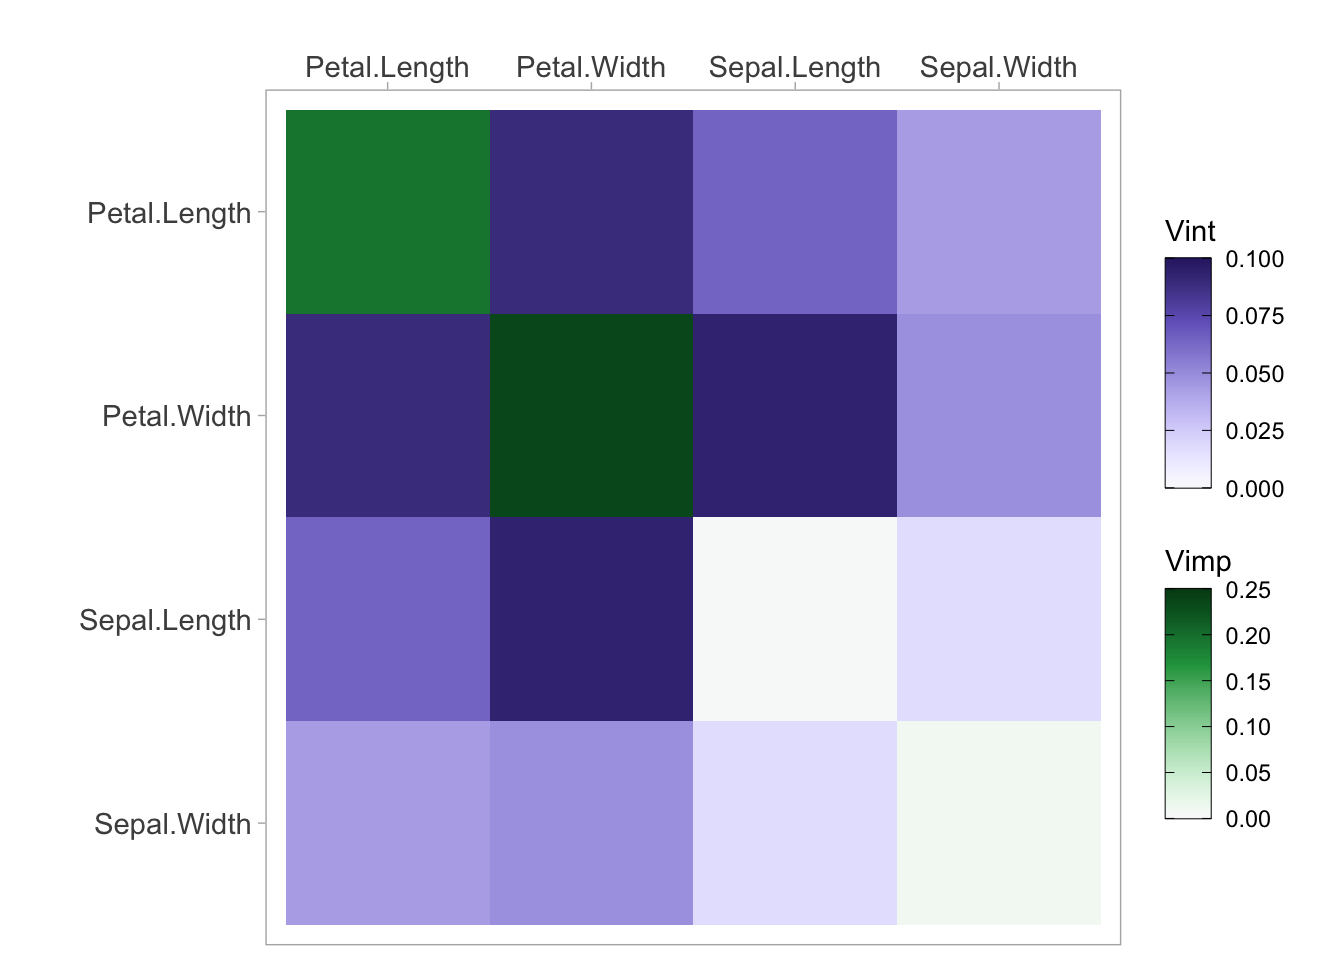
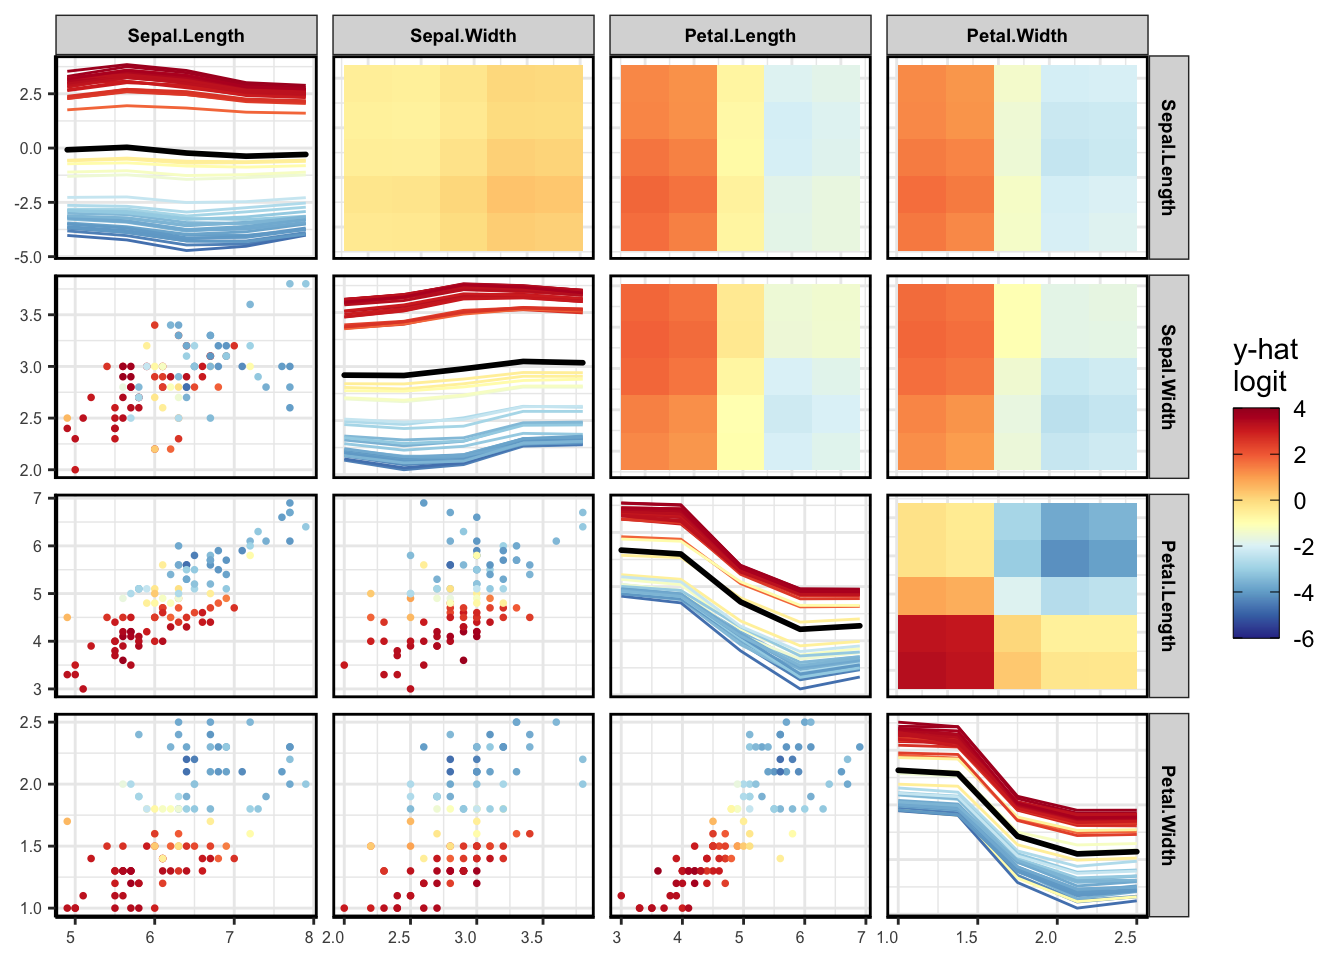
PDP
pdpPairs(data = iris2,
         fit =  bm,
         response = "Species",
         nmax = 500,
         gridSize = 10,
         nIce = 50)