corrSolar
corrSolar.RdThis function creates a solar system plot of correlations between variables in a dataset.
corrSolar(mat, sun = NULL)Arguments
- mat
A square correlation matrix to visualise.
- sun
A character string specifying the column name in the dataset to be treated as the 'sun' in the solar system plot.
Value
An solar system plot displaying correlations.
Details
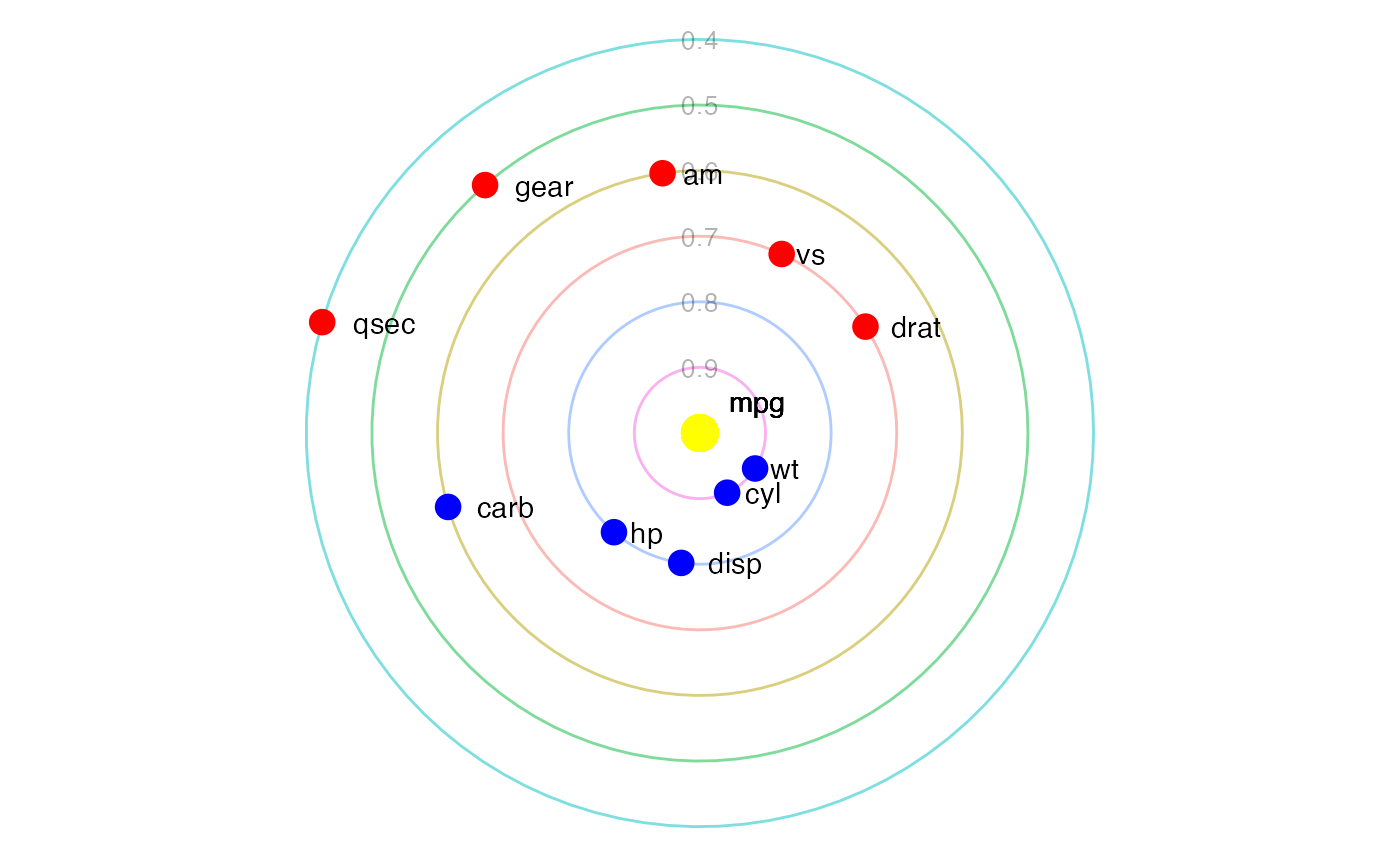
In a solar system correlation plot, the dependent variable of interest is positioned at the center, represented as the sun. The explanatory variables are depicted as planets orbiting around the sun, with their distance from the sun corresponding to the absolute value of their correlation with the dependent variable. Therefore, the greater the distance of a planet from the sun, the weaker the correlation between the explanatory variable and the dependent variable.
Examples
cm <- cor(mtcars)
corrSolar(mat = cm,
          sun = 'mpg')